Across the globe, think tanks play an important role in shaping policy discourse. They are often referred to as an opinion creator and a source of in-depth policy analysis. The challenges faced by think tanks include, among others, effective dissemination of their work/research findings to a highly segmented audience using a variety of mediums and tools.
In the words of James G. McGann of the Think Tanks and Civil Societies Program (TTSP), University of Pennsylvania, "Gone are the days when a think tank could operate with the motto 'research it, write it and they will find it'”. This reiterates the need and importance for think tanks to strengthen their communications strategies.
However, the role of communications is not merely packaging of knowledge products, capturing of messages and their dissemination. It also involves systematic mapping of audience/stakeholders, assessing the correct medium/communication tool to be used for each one of them, understanding the uptake and ultimately influencing the policy discourse. Therefore, the Right information to the Right audience using the Right medium at the Right time (4 R’s) could be the Mantra for a smart communications plan.
Choosing the right medium is essential to ensure the success of an organisation’s dissemination strategy. As stated by Marshall McLuhan, a visionary of communications, “The medium is the message” – because it is the “medium that shapes and controls the scale and form of human association and action” (Understanding Media, NY, 1964, p. 9). Both offline and online mediums are equally important for effective communication and outreach. One needs to be mindful of which medium is to be used, with whom and when. Need and importance of online communication tools and techniques, mainly Infographics, is what this piece focuses on.
Needless to say, online mediums are increasingly gaining importance worldwide. As per a survey by the Global Web Index (2018), the number of internet users worldwide is 4.021 billion, up by 7 percent year-on-year and the number of social media users worldwide is 3.196 billion, up by 13 percent year-on-year. This goes on to show that digital platforms have emerged as a crucial medium and should be tapped aptly in order to reach and influence netizens.
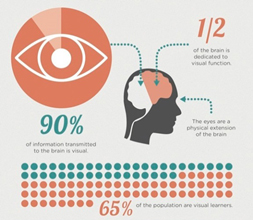
 Source: The Infographics Agency Source: The Infographics Agency |
Not to forget, in today’s Message-Saturated World people are flooded with information from various sources at all times. Due to increased flow of information, people’s attention span has reduced drastically. Hence, in an era where everything is fast paced, information needs to be quick, catchy and easy to digest. It has been argued that almost 65 percent of people are visual learners; hence, it is important to design communications plan and products appropriately so they don’t go unnoticed. |
Use of Infographics in communications products is one of the effective techniques to reach masses in a short span of time. Infographics are a powerful internet-based communication medium that brings together visuals and text, thus making it easy for people to absorb a host of information without much struggle.
In a recent survey, it is found that infographics/visualisations help “communications professionals reach their target audience in more meaningful ways than virtually any other type of medium". It was also found that 84 percent of the organisations who have used infographics consider the medium to be effective.
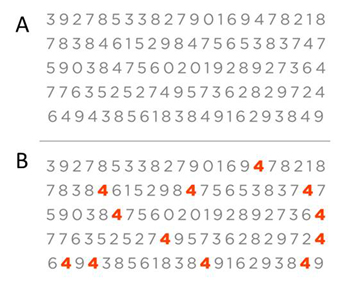
To illustrate how visuals are much more effective than simply stating numbers, sharing an example used by Bill Shander in one of his articles on use of visualisations could help:

In case “A”, the reader has to read each and every number and it becomes tiresome after a point and there are chances of him/her abandoning the exercise. Whereas in case “B” (wherein 4 has been highlighted with a different color), the reader can count it in much lesser time without losing attention.
As seen above, presenting data in a visually appealing manner does help. Infographics is often referred to as a medium that tells a “data story”; it draws and holds users’ attention. It also helps in demystifying complex data and hence delivering the intended message easily.
It will be interesting to look at how CBGA has managed to attract more traffic on its website. CBGA being a policy research organisation has always worked hard to present technical data and information in an accessible and easy to comprehend manner. In 2016, a new section ‘Budget Simplified’ (currently subsumed under ‘Union Budget Explorer’) was introduced on the website. The section helps in exploring important data, generate visualisations and develop insights from the Union Budget documents for the latest financial year. In April 2016, soon after the launch, the section attracted new users. Around the same time in 2017, the number of new users has increased by 300 percent indicating significant improvement in the user traffic (as per Google Analytics).
Effectively connecting and reaching out to the right audience at the right time is one of the major challenges that think tanks tend to face. Though use of Infographics might not be the only solution, it is certainly one of the effective ways of disseminating information to various stakeholders. Online platforms and tools cannot be ignored - after all, we are living in a Digital Age!
The views expressed in this piece are those of the author, and do not necessarily reflect the position of CBGA. You can reach Shuchita Rawal at shuchita@cbgaindia.org.


 9 August 2018