Insights

Receipts Indicators (Updated for FY 2023-24)
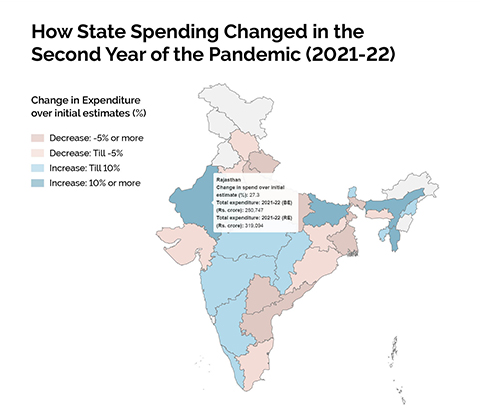
This set of Data Visualisation provides an overview of the fiscal status of the States in terms of select receipt indicators. Moreover with the appointment of the 16th Finance Commission (FC) soon, it would be useful to review the fiscal performance of the states during the 15th FC period (2020-21 and 2023-24) especially as during this period the Indian economy severely grappled with the global pandemic of COVID-19. This has led to redesigning of public policies and allocation of fiscal resources from the Union to the States to combat the challenges posed by the pandemic.
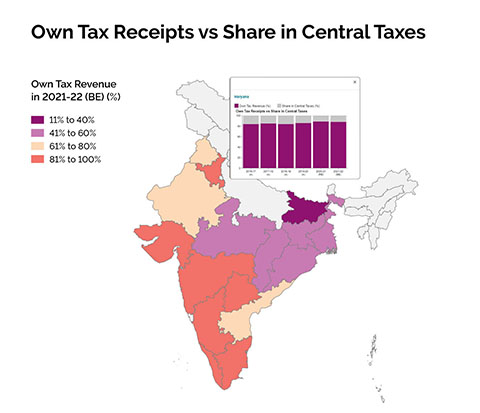
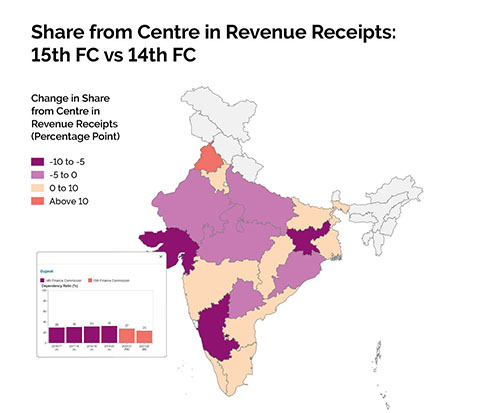
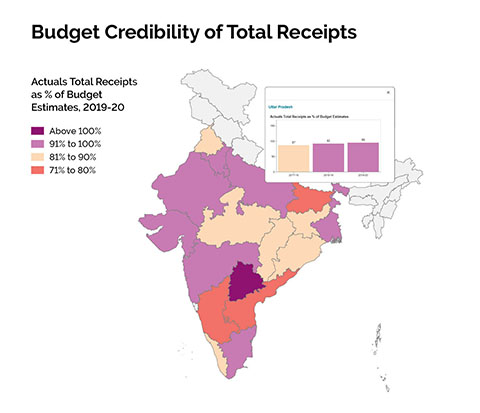
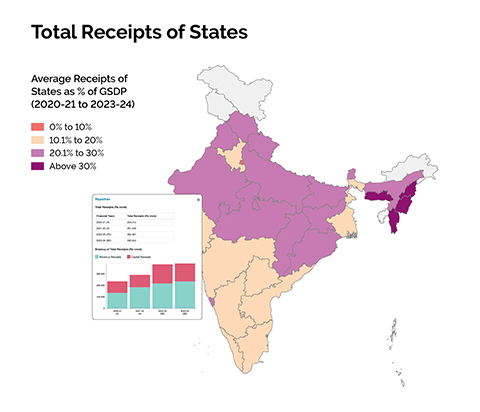
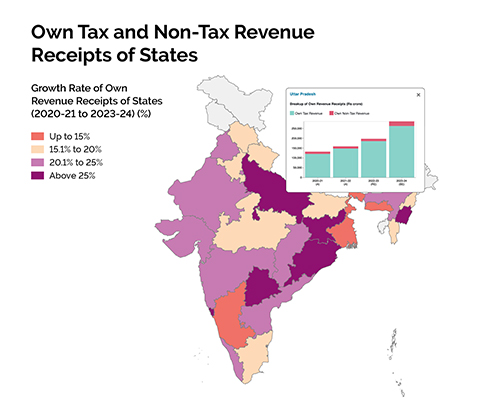
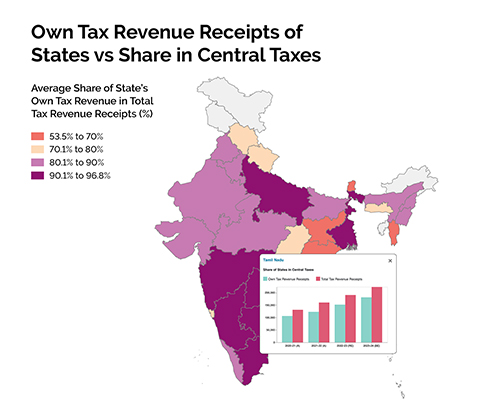
Receipts Indicators
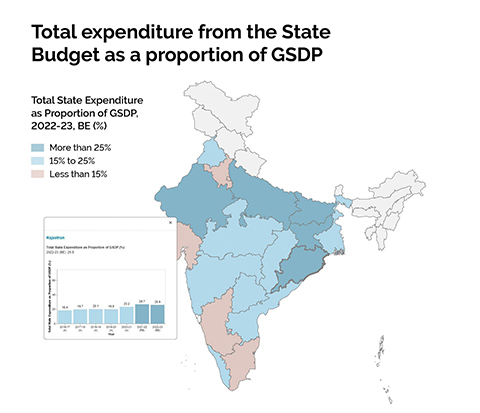
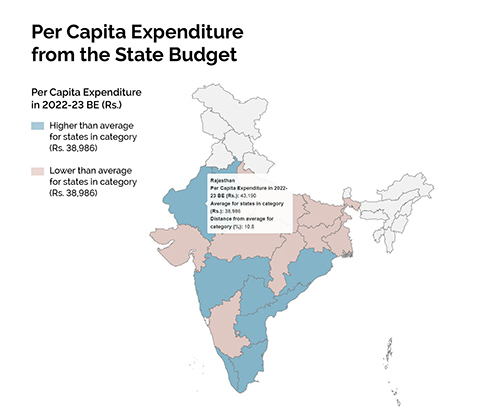
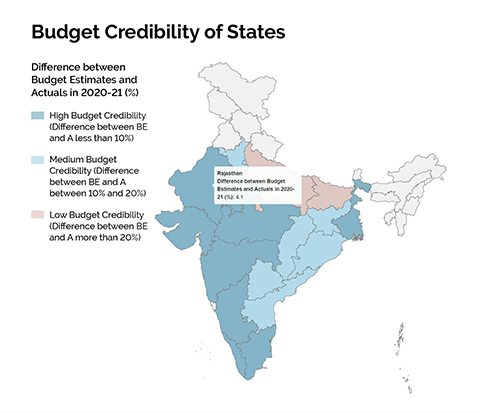
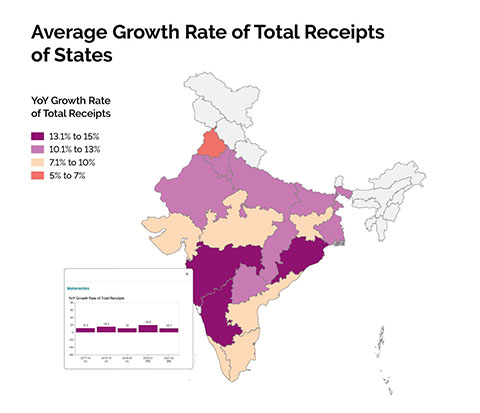
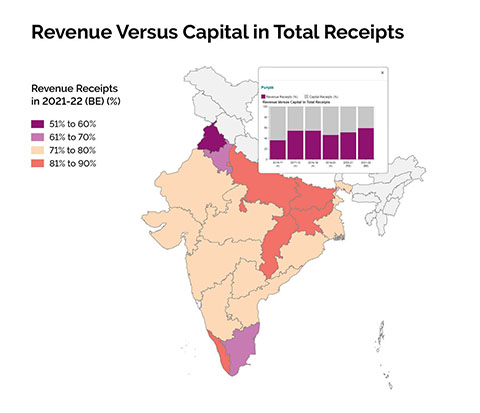
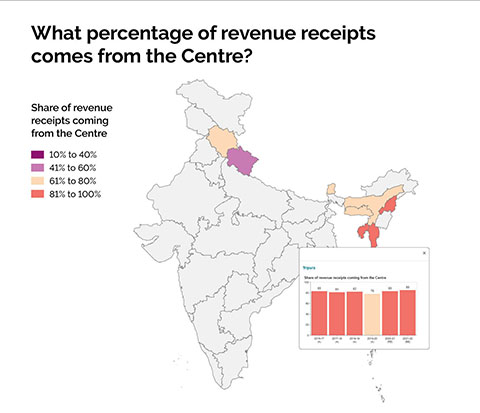
Governments’ ability to spend on welfare schemes are ultimately dependent on the resources they have. Indian state governments have a number of different sources, like own tax receipts, non-tax receipts, share in central taxes, transfer from Union Governments, etc. These visualisations provide an overview of how states’ receipts have grown in the last 6 years, how dependent states are on central government for resources, and how reliable the receipts projections have been.
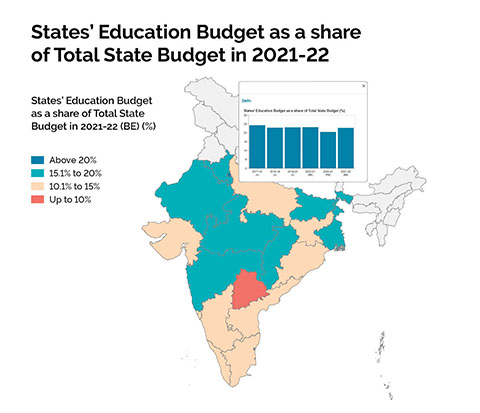
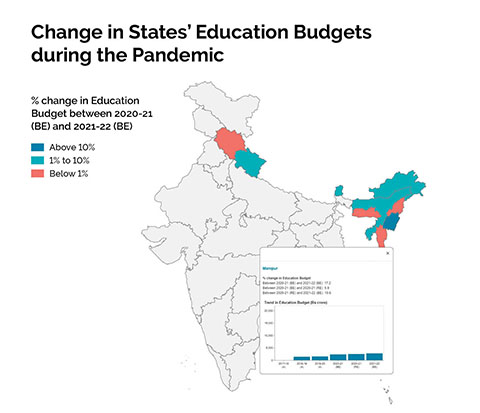
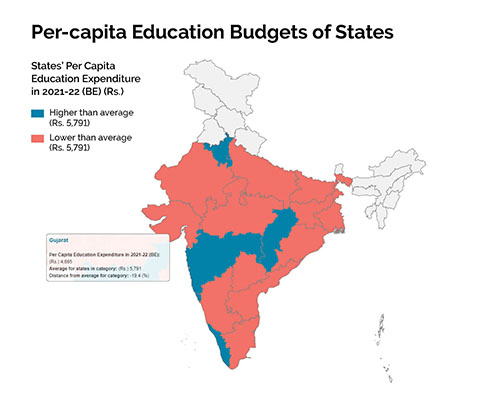
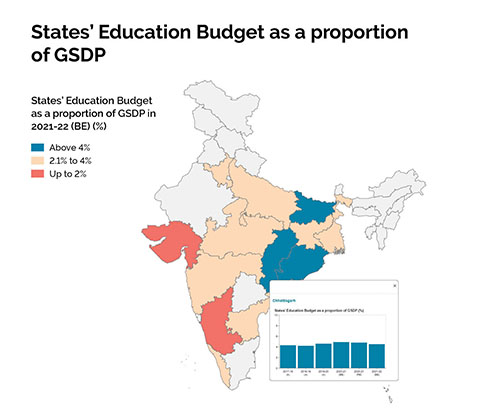
Education Sector Budgets of States
Public provisioning for different social and economic sectors, especially at the backdrop of the pandemic, has been much discussed. Education is one such sector for which government budgets play a critical role in ensuring inclusive and equitable learning for children across the country. The following set of visualisations provide a comparative picture of how the education sector has been provisioned for by the different states, both in terms of absolute allocations as well as in shares and per capita forms.